In 1943, four local newspapers published a New York City Market Analysis. Largely forgotten in the 70 years since, the document provides an amazing window into New York's neighborhoods of that era.
The 250-page Market Analysis provides hundreds of photos & color-coded maps, statistics, and short narratives about neighborhoods across the city. The statistics and maps are based on the 1940 Census, providing a rich complement to the individual 1940 Census records that are available online.
The Center for Urban Research at the CUNY Graduate Center is making the 1943 profiles available to provide context for the 1940 Census records and to offer a research aid to historians and anyone else interested in learning more about New York from the 1940s. Read our announcement for more info.
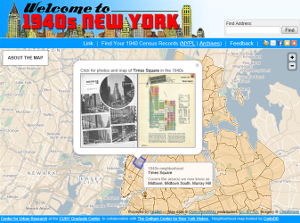
Our Welcome to 1940s New York website displays a map of New York divided into the 116 neighborhoods that are covered in the 1943 Market Analysis. You can:
We have also analyzed some of the demographic changes in New York City between 1940 and 2010. Please visit CUR's website for more info.
Please let us know what you think.